
2022ATC in-depth interpretation (2): In-depth correlation analysis between ddcfDNA detection and Banff pathological indicators
In studies pairing donor-derived cell-free DNA (ddcfDNA) detection with biopsy pathology, ddcfDNA has been shown to be diagnostic of rejection. With the deepening of research, clinical trials have begun to further explore the correlation between ddcfDNA detection values and Banff diagnostic indicators. A total of 6 representative studies at this ATC conference focus on this direction. Next, I will
In studies pairing donor-derived cell-free DNA (ddcfDNA) detection with biopsy pathology, ddcfDNA has been shown to be diagnostic of rejection. With the deepening of research, clinical trials have begun to further explore the correlation between ddcfDNA detection values and Banff diagnostic indicators. A total of 6 representative studies at this ATC conference focus on this direction, which we will explain in detail next.
First Research:Is there any correlation between the scores of Banff pathological indicators g, ptc, t, i, C4d, etc. and ddcfDNA?
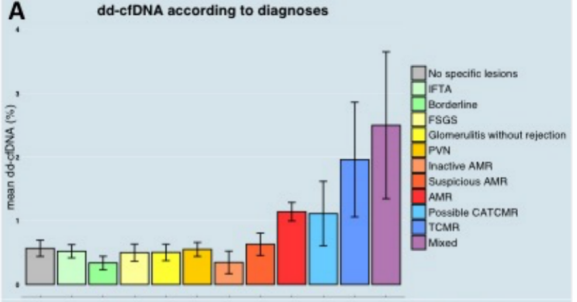
Existing small-scale single-center studies have shown that ddcfDNA can diagnose rejection more specifically. The team of Professor O. Aubert of the Paris Translational Center for Organ Transplantation, Paris, France verified this on a larger sample size (1210 needle biopsy samples).And toddcfDNADetection value andBanffindicatorg、ptc、t、i、C4dandcgRating correlations were analyzed. This study retrospectively enrolled 992 kidney transplant patients, and evaluated their pathological biopsy results, HLA-DSA, and renal function indicators simultaneously. A total of 1210 pathological biopsy results and paired ddcfDNA test results were divided into training set (N=637) and validation set (N=573) cohorts. In the training set cohort, 100 AMRs, 14 TCMRs, and 7 mixed rejections were included (Banff 2019). Logistic regression was used to analyze the association between ddcfDNA univariate and multiple variables including ddcfDNA, DSA, etc., and rejection, and the independently associated variables were used to establish a rejection risk diagnostic model, which was further used for validation in the validation set cohort.The results showed that compared with other types of transplanted kidney injury pathology, the detection value of ddcfDNA in AMR and/or TCMR was significantly higher (Figure 1A).
(Figure 1A)
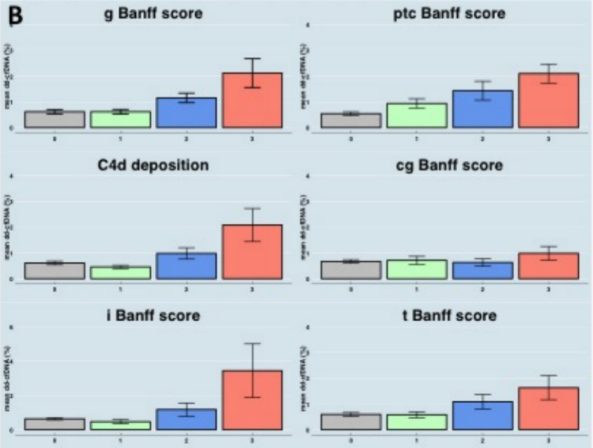
Further analysis showed that the ddcfDNA detection value was linearly correlated with the Banff standard acute lesion indicators, but was not linearly correlated with the chronic lesion indicators (Figure 1B).
(Figure 1B)
In multivariable logistic regression analysis, variables (or factors) independently associated with rejection were HLA-DSA (p<0.0001), ddcfDNA (p<0.0001), eGFR (p=0.018), recent rejection history (p<0.0001), and unstable renal function indicators (p=0.013). The risk model showed that the area under the curve (AUC) of the receiver operating characteristic curve (ROC) without the ddcfDNA variable was 0.769, and the AUC with the ddcfDNA variable increased to 0.827; in the validation set cohort, the AUC without the ddcfDNA variable was 0.786, and the AUC with the ddcfDNA variable increased to 0.824.This study believes that ddcfDNA can be used as an independent relevant risk variable in the diagnosis of kidney transplant rejection.And this risk model is the first integrated system that can improve patient postoperative monitoring and help clinicians make decisions.
Second Research: ddcfDNA inWhat is the difference in C4d positive ABMR vs C4d negative ABMR?
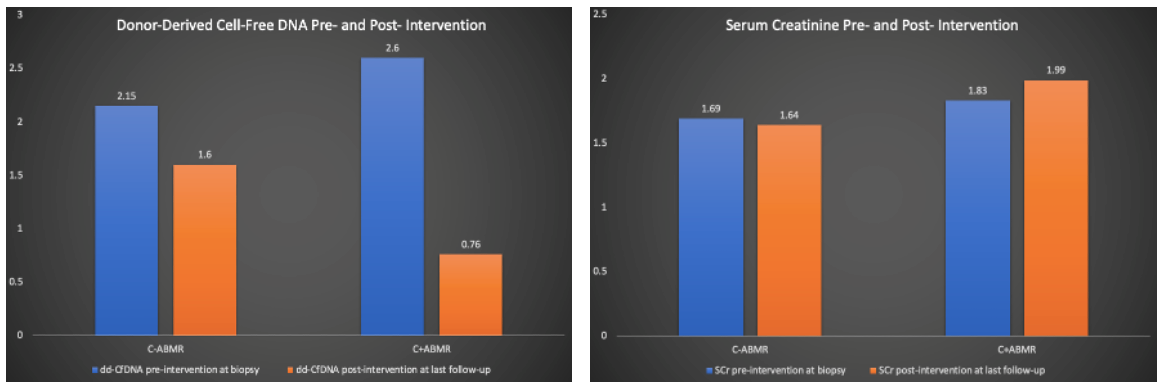
The ddcfDNA test can make up for the hysteresis of creatinine and the variability of traditional histopathological diagnosis (differences in different pathologists' readings and different puncture points). Researchers at the University of Texas Medical Branch (Internal Medicine, Nephrology, Galveston) used ddcfDNA and MMDx tests to monitor ABMR diagnosis and treatment, and compared ABMR classification into C4d positive (C+) and C4d negative (C-) to further evaluate the difference in ddcfDNA between the two groups. The study enrolled 50 patients with ABMR, who were divided into a C4d-positive ABMR group (C+ABMR, 16 patients) and a C4d-negative ABMR group (C-ABMR, 34 patients) based on histopathological staining. The SCr, ddcfDNA and DSA indicators were detected before puncture, after puncture and after treatment. The C+ABMR group was given IV immune globulin (IVIG)/plasma exchange +/-bortezomib treatment, and the C-ABMR group was given IVIG treatment. After treatment, the maintenance immunosuppressive dose of both groups was increased accordingly. The results showed that 50% of the patients in the C+ABMR group and 52% of the patients in the C-ABMR group were DSA positive.ddcfDNA of two groupsThe detection value is inAfter treatment, there was a significant decrease in creatinine, but there was no significant change in creatinine (Fig.2)。In addition, when the MMDx test results were used as the gold standard, 55% of the patients in the C-ABMR group had ABMR negative results, while 81% of the patients in the C+ABMR group had ABMR positive results.
(Figure 2)
This study shows that adding ddcfDNA testing to the ABMR diagnosis and post-treatment monitoring process, and adding MMDx testing solutions to the traditional pathological biopsy process, can help early identification, timely intervention and individualized treatment of ABMR patients.
Third~Fifth Research:At present, there is still controversy about the treatment of borderline TCMR (boardline TCMR, BL-TCMR) in clinical practice. In cases where ddcfDNA results are inconsistent with pathological diagnosis, does the ddcfDNA detection value have a new reference value?
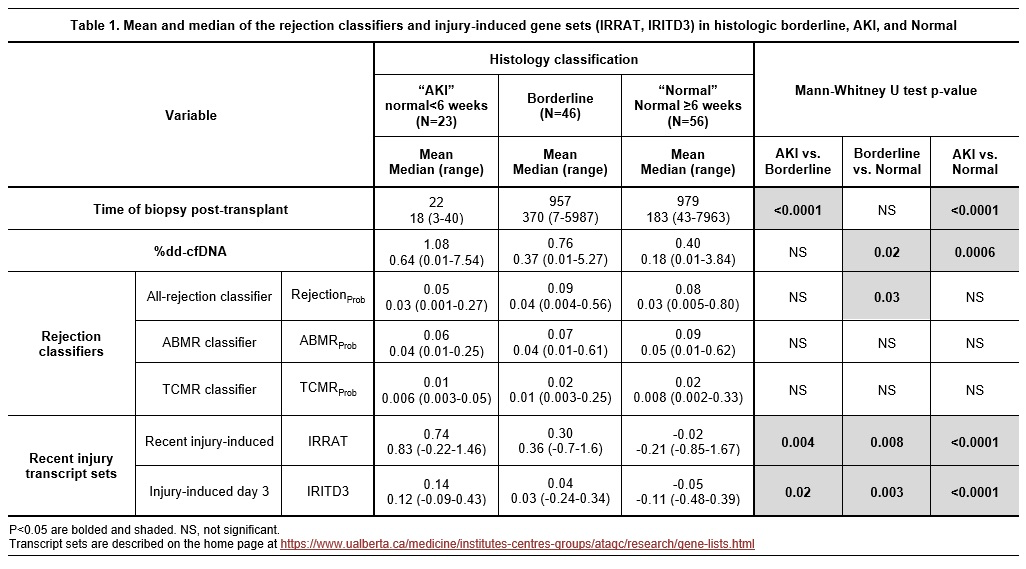
The team of Professor P. F. Halloran from the Alberta Transplant Applied Genomics Centre, Edmonton, AB, Canada, analyzed the ddcfDNA values and molecular pathology (MMDx) characteristics of patients diagnosed with BL-TCMR by traditional histological biopsy. The study collected a total of 426 pathological biopsy samples, divided into BL-TCMR group (46 cases), stable group (56 cases) and acute kidney injury group (AKI, 23 cases). Through MMDx testing, it was found that only 2 cases in the BL-TCMR group achieved rejection: 1 case of ABMR and 1 case of possible-TCMR. The remaining 44 cases did not meet the rejection criteria of MMDx. Further study on the ddcfDNA and MMDx detection results of the BL-TCMR group, AKI group and normal group found that the renal puncture time of the AKI group was significantly earlier than that of the BL-TCMR group and the normal group, while there was no statistical difference (mean, median and range) in the puncture time of the BL-TCMR group and the normal group. The ddcfDNA value showed a gradient decrease among the AKI group, BL-TCMR group and normal group, which was consistent with the damage-related gene transcription expression score.However, there was no significant statistical difference in the transcriptional expression of rejection-related genes among the three groups (Fig.3)。
(Figure 3)
This study shows that borderline histological changes (BL-TCMR) are mainly related to mild molecular damage rather than rejection.Its ddcfDNA value was slightly elevated, which may be a late result of parenchymal injury. Therefore, borderline histological changes may be sustained damage from early AKI and should not be regarded as rejection reactions.
forBL-TCMR Banff pathologyof tubulitis (t0,t1,t2andt3) and renal interstitialitis (i0,i1,i2andi3) different combinations ofcantake advantage ofddcfDNADetection values for the same combination (BanffDifferentiate between patients with the same pathological diagnosis)、Hierarchical classification?
A team of Professor M. J. Ellis from Duke University, Durham, NC conducted research on this. This study retrospectively analyzed the correlation between ddcfDNA detection levels and tubulitis and nephrointerstitial inflammation in patients diagnosed with BL-TCMR on pathological biopsy. A total of 56 patients with pathological biopsy results (BL-TCMR, Banff 2019) and ddcfDNA paired test results within 30 days after biopsy were enrolled. The results showed that the median value of ddcfDN in 56 patients was 0.34% (IQR: 0.17-1.00). Among them, 3 cases scored t3/i1 (ddcfDNA%: 0.04%, 4.85%, 9.06%), and 1 case scored t1/i3 (ddcfDNA%: 3.03%). The number of enrolled patients with both scores was small. The pathological scores of BL-TCMR were further divided into five groups (t1/i1, t2/i1, t3/i1, t1/i2 and t1/i3), and it was found that there was no significant difference in ddcfDNA values. There was also no significant difference in ddcfDNA values between patients with biopsy results diagnosed as BL-TCMR and patients with biopsy diagnosis of non-BL-TCMR (isolated tubulitis: t1/i0, t2/i0 or isolated interstitial inflammation: t0/i1) (Figure 4). Further analysis found that 31 of the 56 cases also underwent ddcfDNA testing 63 days before the indicated biopsy (IQR: 53.5-100), with a median value of 0.24% (IQR: 0.20-0.37). Compared with the two testing results, the median ddcfDNA testing value in the latter time increased by 55% (IQR: -9 - 235%).
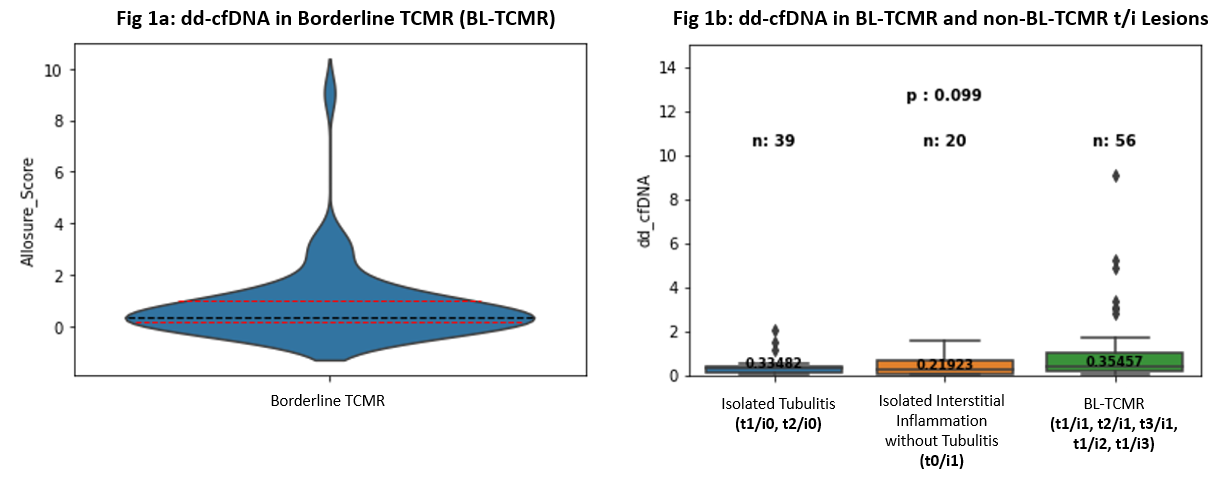
(Figure 4)
This study showed that the pathological manifestations of BL-TCMR Banff were similar, while the ddcfDNA values were greatly different (ddcfDNA%: 0.04%, 4.85%, 9.06% VS ddcfDNA%: 3.03%). However, there was no significant difference in ddcfDNA values among the BL-TCMR group, solitary tubulitis group and solitary interstitial inflammation group.Therefore, it showsBL-TCMR, solitary canalulitis and solitary interstitial inflammation represent a spectrum of molecular insults (a spectrum of molecular injury), the prompt can be passedddcfDNAvalues to risk stratify them.
For risk stratification of TCMR (including BL-TCMR), Professor D. Kumar's team at Virginia Commonwealth University, Richmond, VA, further combined MMDx and ddcfDNA testing to try to classify. Compared with the study by Professor P. F. Halloran's team, the study by Professor D. Kumar's team enrolled 18 patients diagnosed (H+M+) as BL-TCMR by both traditional biopsy pathology (H) and MMDx (M), and analyzed the comparison with the H+M- group. A total of 37 patients were enrolled in this TCMR cohort, including 18 H+M+ and 19 H+M- patients. Patients with viral/bacterial nephritis or mixed rejection were excluded and ddcfDNA was selected to be detected before TCMR treatment. The results showed that the median ddcfDNA value in the H+M- group was significantly lower (p = 0.02) compared with the H+M+ group (0.32%; IQR: 0.15-0.43), which was more obvious when the interstitial inflammation and tubulitis (i+t) scores were higher (4.8±1.5 vs 3.3±1.2, p=0.002). For the H+M+ group, there was a linear correlation between the score of “i+t” and the ddcfDNA value, while for the H+M- group, there was no linear correlation between the score of “i+t” and the ddcfDNA value (Figure 5).
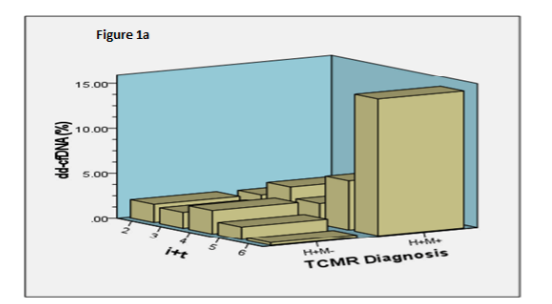
(Figure 5)
In addition, compared with the H+M- group (40±23ml/min/1.73 m2) compared to the H+M+ group (27±19ml/min/1.73 m2) eGFR function was worse at 3 months and beyond after puncture (p=0.06) (Figure 6). In terms of treatment, 89% of H+M+ patients received rejection treatment (16/18; 14 rATGs and 2 steroids only), while only 37% of H+M- patients received rejection treatment (7/19). Even though not all of the H+M- group received rejection treatment, at a median follow-up of 14.7 months, eGFR improved significantly in both groups: it increased to 34±24ml/min/1.73m in the H+M+ group2, increased to 49±26ml/min/1.73m in the H+M- group2, and the rising trend of eGFR in the H+M- group was more obvious than that in the H+M+ group after 3 months.
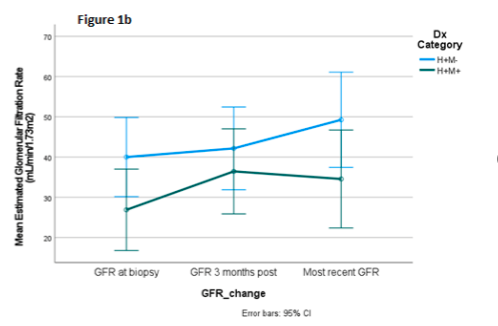
(Figure 6)
The study shows thatFor molecular pathology negative (M-) while traditional pathological biopsy was positive (H+) ofTCMRpatients, generalddcfDNAThe detection value level is relatively low.AlthoughThese patients did not receive targeted treatment, but laterkidney functionsignificant improvement, which suggests that the low-grade TCMR shown by traditional pathology may be a "reaction to trauma" rather than a rejection reaction.Non-invasiveddcfDNATesting is helpful forTCMRPatients are graded and classified.
Sixth Research: Can ddcfDNA be used in combination with gene expression profiling to diagnose the occurrence of MVI?
The main pathological manifestation of ABMR is microvascular inflammation (MVI). Professor S. Parajuli's team at the University of Wisconsin-Madison hopes to diagnose the occurrence of MVI by using both ddcfDNA (Allosure, AS) and gene expression profiling detection (Allomap kidney, AMK). Through a prospective study of DSA-positive kidney transplant patients in the All-MAP study (NCT04057742), the characteristics of the composite score of AS+AMK in the diagnosis of MVI>1 were analyzed. A total of 27 renal biopsy tissue samples (26 patients) were enrolled in the study, and the DSA class I MFI value was 543±1497, and the class II MFI value was 16374±14337. Use the MVI =-9.1444+2.3122 * AS+0.5462 * AMK formula to distinguish MVI 0, MVI 1, MVI 2 and above samples. The median values of AS, AMK and AS + AMK composite scores were 0.76, 11.7 and -0.3616 respectively. The AUC of the AS + AMK composite score in diagnosing MVI > 1 is 0.87, which is highly accurate. When the cut off value is -0.3981, the sensitivity reaches 0.92, the specificity reaches 0.73, the PPV is 0.73, and the NPV is 0.92. When the cut off value increased to 0.82, the sensitivity was 0.58, the NPV was 0.75, and the specificity and PPV were 100%; when the cut off value dropped to -3.17, the sensitivity and NPV were 100%, specificity 27%, and PPV 52% respectively (Figure 7).
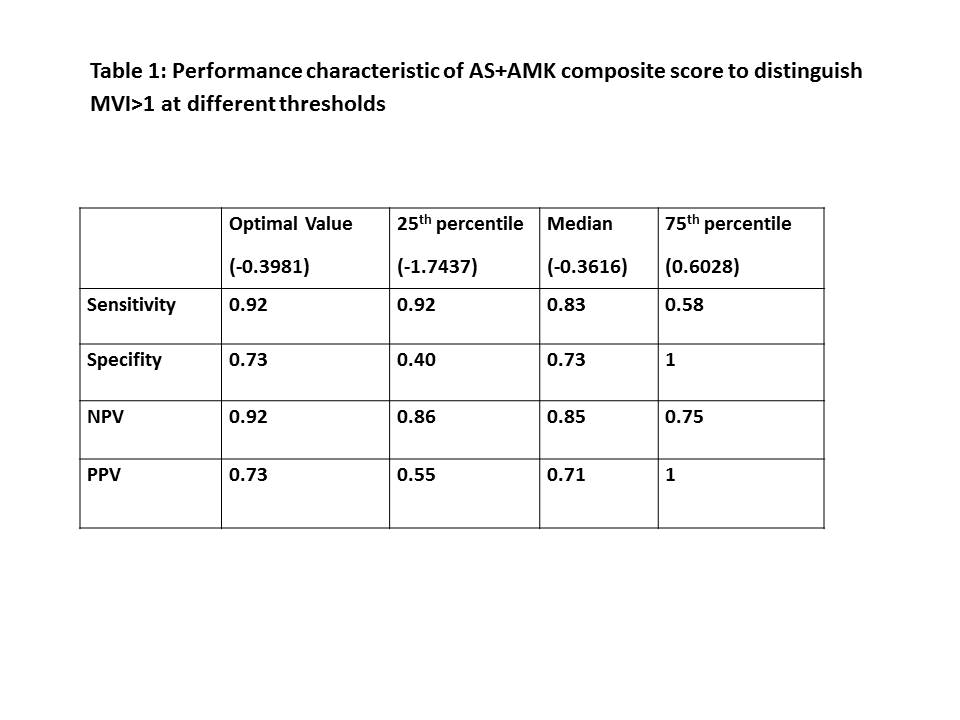
(Figure 7)
Summary
- The ddcfDNA detection value has a good linear relationship with the rejection damage indicators in Banff, and can diagnose the occurrence of microvascular inflammation;
- It also has good diagnostic value for C4d-negative ABMR, and has a role in evaluating the efficacy of ABMR treatment;
- It is suggested that ddcfDNA can be used as a biomarker for BL-TCMR risk classification, which is beneficial to the precise clinical treatment of BL-TCMR.
【Reference】
1.Aubert O,et al.Development and Validation of an Integrative DD-CFDNA System to Predict Allograft Rejection: A Population Based Study [abstract]. Am J Transplant. 2022; 22 (suppl 3).
https://atcmeetingabstracts.com/abstract/development-and-validation-of-an-integrative-dd-cfdna-system-to-predict-allograft-rejection-a-population-based-study/.
2.Rizvi A,et al.Antibody-Mediated Kidney Allograft Rejection (ABMR) Monitoring and Intervention Based on ABMR Subtypes – A Step Towards Precision Diagnosis and Management[abstract]. Am J Transplant. 2022; 22 (suppl 3).
https://atcmeetingabstracts.com/abstract/antibody-mediated-kidney-allograft-rejection-abmr-monitoring-and-intervention-based-on-abmr-subtypes-a-step-towards-precision-diagnosis-and-management/
3.Halloran PF,et al.Histologic Borderline Reflects Molecular Injury Not Rejection: Results from the Trifecta Study[abstract]. Am J Transplant. 2022; 22 (suppl 3).
https://atcmeetingabstracts.com/abstract/histologic-borderline-reflects-molecular-injury-not-rejection-results-from-the-trifecta-study/.
4.Ellis MJ,et al.Wide Spectrum of Molecular Injury Highlights Heterogeneity of Banff Tubulitis and Interstitial Inflammation Lesions[abstract]. Am J Transplant. 2022; 22 (suppl 3).
https://atcmeetingabstracts.com/abstract/wide-spectrum-of-molecular-injury-highlights-heterogeneity-of-banff-tubulitis-and-interstitial-inflammation-lesions/.
5.Kumar D,et al.Correlation of Donor-Derived Cell-Free DNA with Histology and Molecular Diagnoses of T-cell Mediated Rejection in Kidney Transplant Biopsies[abstract]. Am J Transplant. 2022; 22 (suppl 3).
https://atcmeetingabstracts.com/abstract/correlation-of-donor-derived-cell-free-dna-with-histology-and-molecular-diagnoses-of-t-cell-mediated-rejection-in-kidney-transplant-biopsies/.
6.Parajuli S,et al.A Novel Approach to Non-Invasive Multimodality Testing with Allosure and Allomap Predicts Microvascular Inflammation with High Accuracy in Kidney Transplant Recipients [abstract]. Am J Transplant. 2022; 22 (suppl 3).
https://atcmeetingabstracts.com/abstract/a-novel-approach-to-non-invasive-multimodality-testing-with-allosure-and-allomap-predicts-microvascular-inflammation-with-high-accuracy-in-kidney-transplant-recipients/.
*Pictures and original English text are from the 2022ATC Conference
Some original figures, videos and downloadable materials are provided in Chinese.